Файл:Components of the Cryosphere.tif

Материал из Циклопедии
Перейти к навигации Перейти к поиску

Исходный файл(2048 × 2650 пкс, размер файла: 20,91 Мб, MIME-тип: image/tiff)

Этот файл из на Викискладе и может использоваться в других проектах. Информация с его страницы описания приведена ниже.

Краткое описание

Описание
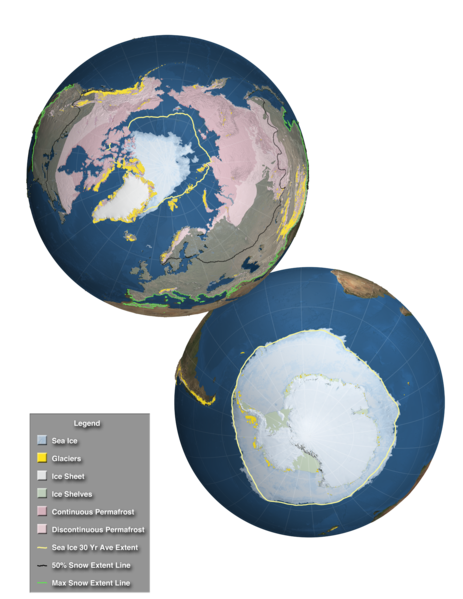
English: This high resolution image, designed for the Fifth Assessment Report of the Intergovernmental Panel on Climate Change, shows the extent of the regions affected by components of the cryosphere around the world. Over land, continuous permafrost is shown in a dark pink while discontinuous permafrost is shown in a lighter shade of pink. Over much of the northern hemisphere's land area, a semi-transparent white veil depicts the regions that are affected by snowfall at least one day during the perion 2000-2012. The bright green line along the southern border of this region shows the maximum snow extent while a black line across the North America, Europe and Asia shows the 50% snow extent line. Glaciers are shown as small golden dots in mountainous areas and in the far northern and southern latitudes. Over the water, ice shelves are shown around Antarctica along with sea ice surrounding the ice shelves. Sea ice is also shown at the North Pole. For both poles. the 30 year average sea ice extent is shown by a yellow outline. In addition, the ice sheets of Greenland and Antarctica are clearly visible.
Дата
Источник Goddard Multimedia
Автор NASA/Goddard Space Flight Center Scientific Visualization Studio

Лицензирование

Public domain Этот файл находится в общественном достоянии (англ. public domain), так как он был создан NASA (Национальным управлением по аэронавтике и исследованию космического пространства). Политика авторского права NASA гласит, что «Материал NASA не защищается авторским правом, если не указано иное». (См. Template:PD-USGov, страницу политики авторского права NASA или политику использования изображений JPL.)
Предупреждения:

Краткие подписи

Добавьте однострочное описание того, что собой представляет этот файл

Элементы, изображённые на этом файле

изображённый объект

image/tiff

21 926 408 байт

2650 пиксель

2048 пиксель

История файла

Нажмите на дату/время, чтобы увидеть версию файла от того времени.

Дата/времяМиниатюраРазмерыУчастникПримечание
текущий14:22, 3 декабря 2013Миниатюра для версии от 14:22, 3 декабря 20132048 × 2650 (20,91 Мб)wikimediacommons>Originalwana{{Information |Description ={{en|1=This high resolution image, designed for the Fifth Assessment Report of the Intergovernmental Panel on Climate Change, shows the extent of the regions affected by components of the cryosphere around the world. Over...

Следующая страница использует этот файл:

Метаданные